LinkedIn Analytics: What to Track and What to Ignore
What each metric means, the ones that actually matter and a 15 minute weekly review that tells you what to post next.

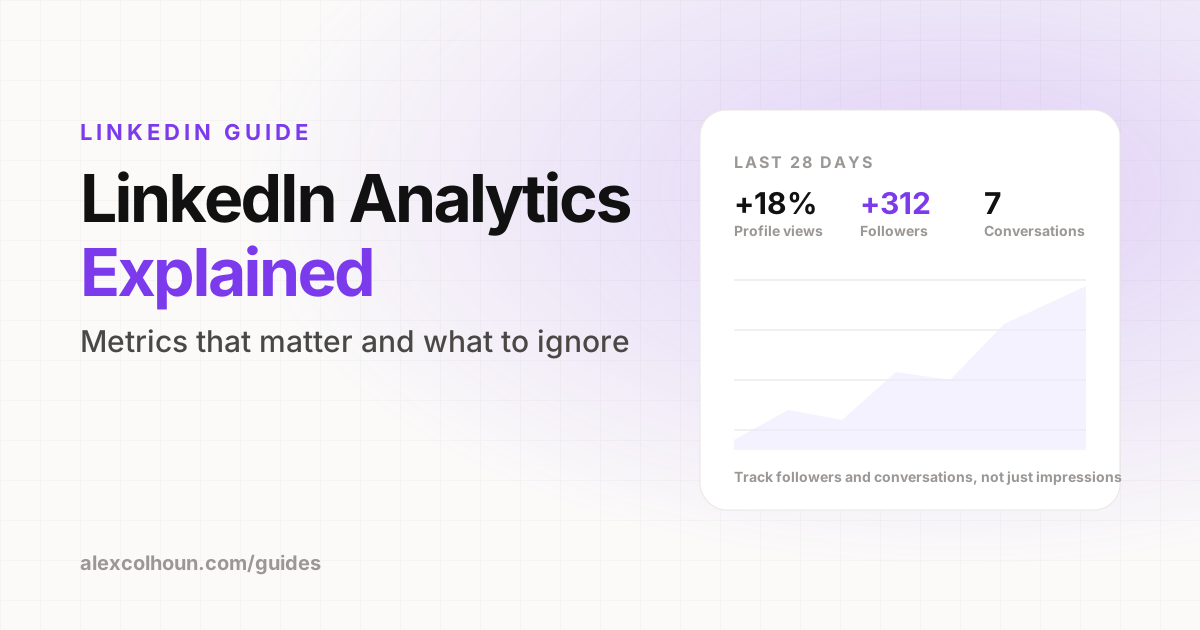
LinkedIn analytics show how your content and profile perform: impressions, members reached, engagement, new followers, profile viewers and search appearances. The numbers that matter most for growing a business are followers gained, profile views and conversations started, not impressions alone. Review your analytics weekly, compare posts by topic, format and hook, and do more of what brings in the right people.
Most people open LinkedIn analytics, look at impressions, feel good or bad for a moment and close the tab. That is a waste of the most useful feedback loop on the platform. Your analytics tell you exactly what your audience wants more of, if you know where to look.
Here is what each metric means, which ones to focus on, and a simple weekly review that takes 15 minutes.
Where to find your LinkedIn analytics
- Profile dashboard: on your profile, the analytics section shows post impressions, followers, profile viewers and search appearances.
- Content analytics: click into post impressions to see performance over time and your top posts.
- Individual post analytics: under any of your posts, click the analytics or impressions link to see that post's numbers and who engaged with it.
- Audience analytics: see your followers' job titles, locations, industries and company sizes.
Exact labels and features shift as LinkedIn updates its product, but these core views have been stable for a long time.
LinkedIn metrics explained
| Metric | What it means | What it tells you |
|---|---|---|
| Impressions | How many times your post was shown | Reach and distribution |
| Members reached | How many unique people saw it | True audience size of the post |
| Reactions, comments, reposts | Public engagement | How much the post resonated |
| Saves and sends | People keeping or sharing it privately | How useful it was |
| Profile views from a post | People who clicked through to your profile | Interest in you, not just the post |
| Followers gained | New followers from a post or period | Whether your content builds an audience |
| Profile viewers | Who looked at your profile | Warm leads and interest |
| Search appearances | How often you appeared in LinkedIn search | Profile discoverability |
The metrics that actually matter
Impressions are a vanity metric on their own. A post with 200,000 impressions from the wrong audience is worth less than a post with 5,000 impressions that leads to three sales conversations. Rank your metrics like this:
- Conversations and leads: DMs, booked calls and clients. LinkedIn does not track these for you, so track them yourself.
- Profile views and followers gained: signs that people want more of you.
- Saves, sends and thoughtful comments: signs that the content was genuinely useful.
- Impressions and reactions: useful context, but not the goal.
Check that you are reaching the right people
Your audience analytics are the most underused feature on LinkedIn. Every month, look at your followers' job titles, industries and locations, plus the demographics of people engaging with your top posts. Ask: is this who I want to sell to? If your audience is mostly other creators or job seekers and you sell to founders, your content needs to shift toward founder problems.
A 15 minute weekly analytics review
- List last week's posts with their impressions, engagement, profile views and followers gained.
- Mark the topic, format and hook type for each one.
- Find the top performer by followers and profile views, not impressions.
- Ask why it worked: topic, hook, format, timing or something else?
- Plan next week with at least one post that builds on the winner.
- Log conversations and calls that came from LinkedIn this week.
Build a simple tracking sheet
| Column | Example |
|---|---|
| Date | Tuesday, 8 AM |
| Topic / pillar | Profile |
| Format | Carousel |
| Hook type | Number |
| Impressions | From post analytics |
| Profile views and followers | From post analytics |
| Conversations started | Your own count |
After a month or two, patterns jump out: which pillar brings in buyers, which format earns follows and which hooks your audience responds to.
What is a good engagement rate on LinkedIn?
Engagement rate is engagements divided by impressions. It varies a lot by audience size, niche and format, so external benchmarks are not very useful. The best benchmark is your own average. Track it over time and compare each post to your last 20. A post that beats your average is a signal worth following.
Turning analytics into action
- Low impressions: work on hooks and posting time. See LinkedIn hooks and the best time to post.
- High impressions, few followers: your profile is not converting. See the profile checklist.
- Followers but no leads: add proof posts and a clear next step. See LinkedIn lead generation.
- Wrong audience: narrow your topics to your buyer's problems.
Analytics mistakes
- Judging content by impressions alone.
- Drawing conclusions from one post.
- Checking analytics constantly instead of once a week.
- Ignoring audience demographics.
- Not tracking leads and conversations, the numbers that pay the bills.
Want a ready made tracking sheet and weekly feedback on your numbers? Both are free inside The Growth Innovator community on Skool.
Frequently Asked Questions
What LinkedIn metrics matter most?
For business growth: conversations and leads, then profile views and followers gained, then saves and thoughtful comments. Impressions are useful context but not the goal.
Where do I find my LinkedIn analytics?
In the analytics section on your profile, under each post via the analytics or impressions link, and in your audience demographics.
What is a good engagement rate on LinkedIn?
It varies widely by audience and niche, so the best benchmark is your own average. Compare each post to your last 20.
How often should I check LinkedIn analytics?
Once a week is enough. A short weekly review is more useful than checking every day.